Ethereum Bullish Signal: Real Reversal or Bull Trap?
By Crypto Insights Desk | March 17, 2026
Ethereum (ETH) surged as much as 14.5% in the past 24 hours and over 20% in the last week, breaking above $2,200 for the first time in weeks and hitting a one-month high near $2,320 before settling around $2,329.48 (up ~1.7% on the day). The move marks the strongest weekly performance among major cryptocurrencies and comes after six straight months of red candles.
The trigger? A major technical indicator just flipped bullish for the first time since September 2025 — and history shows this signal has preceded explosive rallies of 52% and 174% in prior cycles.
The SuperTrend Buy Signal: End of the Six-Month Downtrend?
According to market analyst Ali Martinez, the SuperTrend indicator on the daily chart has officially flipped from “Sell” to “Buy.” This is the first such signal since September and coincides with ETH reclaiming the $2,000–$2,150 zone, crossing above its 50-day moving average (first time in 56 days), and re-entering the 12-hour Ichimoku Cloud (first time in 55 days).
In the last two instances of this exact flip, Ethereum launched into massive uptrends. The most recent one propelled ETH to its all-time high of $4,946 in August 2025.
Additional bullish technical developments:
- Seven consecutive green daily candles
- 9.7% weekly gain
- Breakout from the $1,825–$2,150 consolidation range that trapped price since early February
Bull Case: Real Reversal Backed by Institutions & On-Chain Strength
Several catalysts support the view that this is the start of a genuine trend reversal:
- Spot Ethereum ETF inflows turning positive — After weeks of outflows, U.S. spot ETH ETFs recorded $57 million in net inflows on March 11 alone (two-day total $69.6M). BlackRock’s new iShares Staked Ethereum Trust (ETHB) began trading, adding a staking rewards layer that analysts call a “structural bullish signal.”
- Whale accumulation & supply shock — Long-term holders added over 252,000 ETH in February. SOPR (Spent Output Profit Ratio) has dipped to levels signaling exhaustion of panic selling.
- Network fundamentals — A major Ethereum upgrade went live this week, driving anticipatory whale buying. Gas fees and on-chain activity are picking up, while liquid supply continues to shrink.
- Price targets — Clear breakout above $2,400 could open the door to $2,600–$2,800 quickly, with some analysts eyeing $3,000+ if the broader crypto rally sustains.
Bear Case: Classic Bull Trap in the Making?
Not everyone is convinced. Analyst Ted Pillows warns this could be a textbook bull trap:
“IMO, ETH could tap the $2,400 zone… before a reversal to new lows.”
Key risks include:
- Repeated rejection at the $2,160–$2,200 resistance zone earlier in the month
- Six-month bear market structure still dominant on higher timeframes
- Potential liquidity sweep: Rally to $2,400 could wipe out shorts, then reverse sharply to test $1,900–$1,700 liquidity pools
- Broader market dependence — If Bitcoin stalls or macro conditions worsen, ETH’s underperformance could resume
ETH remains down ~53% from its August 2025 peak, and failure to hold above $2,200 would invalidate the SuperTrend flip.
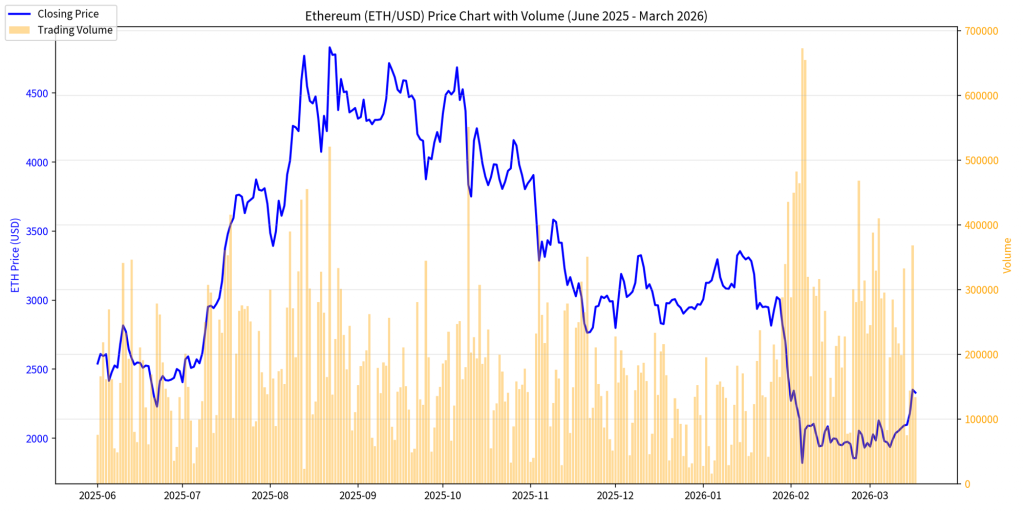
Full Technical Price Chart Analysis (June 2025 – March 2026)
The chart below shows the complete post-peak journey with daily price and volume (290+ trading days):
Key observations:
- ATH & crash: Peaked near $4,946 in August 2025, followed by a brutal 60%+ drawdown.
- Base-building: Prolonged consolidation between $1,825–$2,150 after the early February low.
- Explosive breakout: March 16 volume spike (368k+ units) accompanied the surge above $2,200 and 50-day MA — classic confirmation candle.
- Current momentum: Higher highs forming since the March 13 low (~$2,070). The latest bar shows healthy volume on the pullback, suggesting buyers are defending the move.
- Next levels: $2,400 (immediate resistance), $2,600 (major target), $1,900–$2,000 (critical support zone).
52-week range: ~$1,825 – $4,946
Market cap: ~$280 billion (2nd largest crypto)
24h volume: Elevated at ~$27–$36 billion
Outlook: Confirmation Needed at $2,400
The SuperTrend flip + ETF inflows + whale accumulation create the strongest bullish setup ETH has seen in months. If price holds above $2,200 and clears $2,400 with conviction, the reversal thesis strengthens significantly — potentially targeting $2,600–$3,000 by Q2.
However, the six-month downtrend and repeated resistance failures mean caution is warranted. A failure to sustain above $2,200 or a quick rejection at $2,400 would confirm the bull-trap scenario and likely send ETH back toward $1,900.
Bottom line: This is a high-conviction setup with real institutional backing — but it’s not confirmed until $2,400 is taken out. Trade the breakout with tight stops and watch volume closely over the next 48–72 hours.
Data sourced from Polygon aggregates, TradingView, ETF flow trackers, and on-chain metrics as of March 17, 2026. Cryptocurrency markets are volatile — always do your own research and never invest more than you can afford to lose.